Understand prices. Put movements in context.
TFI PriceChart puts goods and commodity prices in context: monthly World Bank reference prices for energy, metals, precious metals, agriculture and fertilisers – every value with its source, date, method and the checksum of the original file. PriceChart is reference context for your plausibility review, not a valuation of a transaction.
Demo version freely available
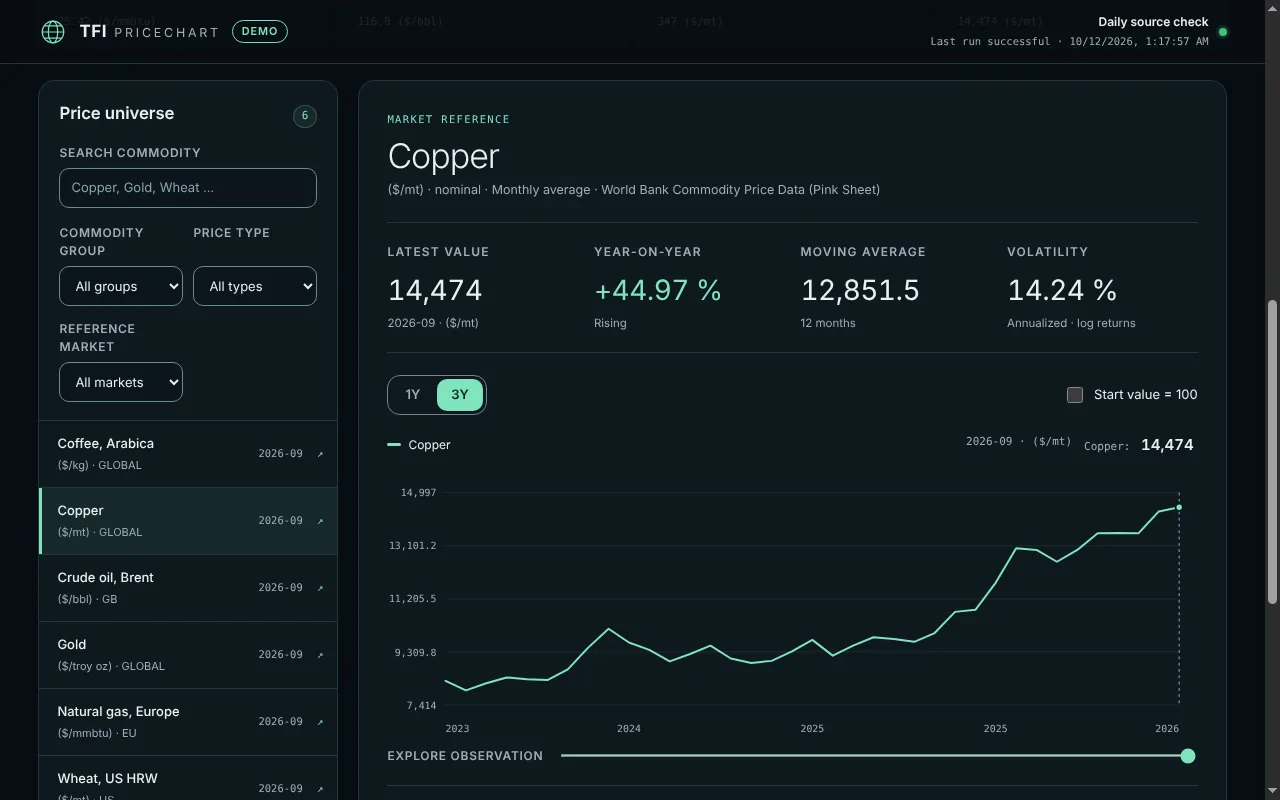
PriceChart in under a minute
The full history of a commodity, the market movement radar, the price check with route costs and the source evidence – with World Bank reference prices.
What PriceChart shows
Market price references, price indices and published trade unit values stay separate, and monthly and annual series are never mixed. Six World Bank monthly series for the last three years are freely available in PriceChart Demo; the rest is part of the full version in TFI TradeCore.
Energy
In the demoBrent crude oil and natural gas in Europe – World Bank monthly averages in original currency.
Metals and precious metals
In the demoCopper and gold.
Agriculture
In the demoWheat (US HRW) and Arabica coffee.
Metrics per series
In the demoYear-on-year change, moving average, annualised volatility and data coverage – no interpolation, gaps stay visible.
Full World Bank history
In TradeCoreAll 180 monthly and annual Pink Sheet series, back to 1960 – market prices, price indices and trade unit values.
FAO Food Price Index
Licence pendingPrepared but not enabled: the FAO publishes its indices under a non-commercial licence. TradeCore shows them only once commercial use is cleared.
Currency views
In TradeCoreDerived EUR, GBP, CHF and JPY views from ECB reference rates (41 currencies) – labelled as an approximation; the original values stay unchanged.
HS link from the case
In TradeCoreFrom a case in TradeCore straight to the series of its HS 2022 chapter – an approximate chapter mapping, not a customs classification.
Export and revisions
In TradeCoreJSON export with source attribution for the file and your analysis; revised values remain traceable alongside their earlier version.
Two editions
PriceChart Demo
Freely availableDemo version, free in the browser, no sign-up, no cookies, no tracking: six monthly World Bank (Pink Sheet) reference price series – Brent crude, European natural gas, copper, gold, wheat (US HRW) and Arabica coffee – over the last three years, in original currency – every value with its source, date, method and SHA-256 checksum. No export, currency conversion or HS mapping.
PriceChart in TFI TradeCore
In TFI TradeCoreThe price indicator module of TradeCore for internal roles: all 180 World Bank series since 1960, currency views from ECB reference rates, the HS chapter link from the case and JSON export – with full provenance and revisions, data checked daily. TradeCore is pre-production; we are glad to show PriceChart in a demonstration.
What you use PriceChart for
- 01
Price plausibility in TBML reviews
Put a unit price from an invoice or letter of credit next to the reference trend of the commodity – evidenced context for deciding whether over- or under-invoicing needs a closer look.
- 02
From the case to the reference series
In TradeCore, the HS code of a case leads straight to the series of its chapter – with source and date for the file.
- 03
Putting market moves in context
See strong year-on-year changes, volatility and a comparison of two commodities before you assess a deviation.
- 04
Evidence for audit and review
Every value leads to its original file, checksum and method – so it stays clear what an assessment was based on.
Every value leads to its source.
- 01
Original values and units are kept; tonnes, barrels or US cents are never silently converted.
- 02
No invented values: monthly series are not turned into daily values, and gaps are not interpolated.
- 03
Reference prices are not executable transaction prices and not a valuation of a transaction.
- 04
No automatic clearance: PriceChart affects neither releases nor price band rules in TradeCore – people decide.
Frequently asked questions
Is PriceChart a price check or a valuation?
No. PriceChart shows published reference prices with their source and method. Whether a price in a transaction is plausible is for your accountable people to judge – PriceChart provides the evidenced context and does not affect any release in TradeCore.
Is PriceChart Demo free?
Yes. PriceChart Demo runs in the browser without sign-up, cookies or tracking and loads no data from third parties. It contains six World Bank monthly series for the last three years; the full version is part of TFI TradeCore.
How current is the data?
The sources are checked every day. The World Bank publishes the Pink Sheet monthly – so PriceChart shows monthly values, not daily prices. Every series shows its latest value, and the view shows when the sources were last checked.
Why only US dollars?
The World Bank quotes these series in US dollars, and PriceChart Demo shows them unchanged in original currency. The full version adds derived EUR, GBP, CHF and JPY views from ECB reference rates – explicitly labelled as an approximation.
See PriceChart in TradeCore?
We show you PriceChart with the full history, currency views and the HS link from the case – and discuss how reference prices fit into your TBML review.
or write to info@tradefinance-intelligence.com