Country risk that cites its source.
TFI RiskChart puts the official classifications for financial crime compliance on one globe: FATF lists, EU high-risk countries, sanctions regimes, export controls and evidenced trade routes. Every colour leads to its source, its date and its limits – no black-box score.
Demo version freely available
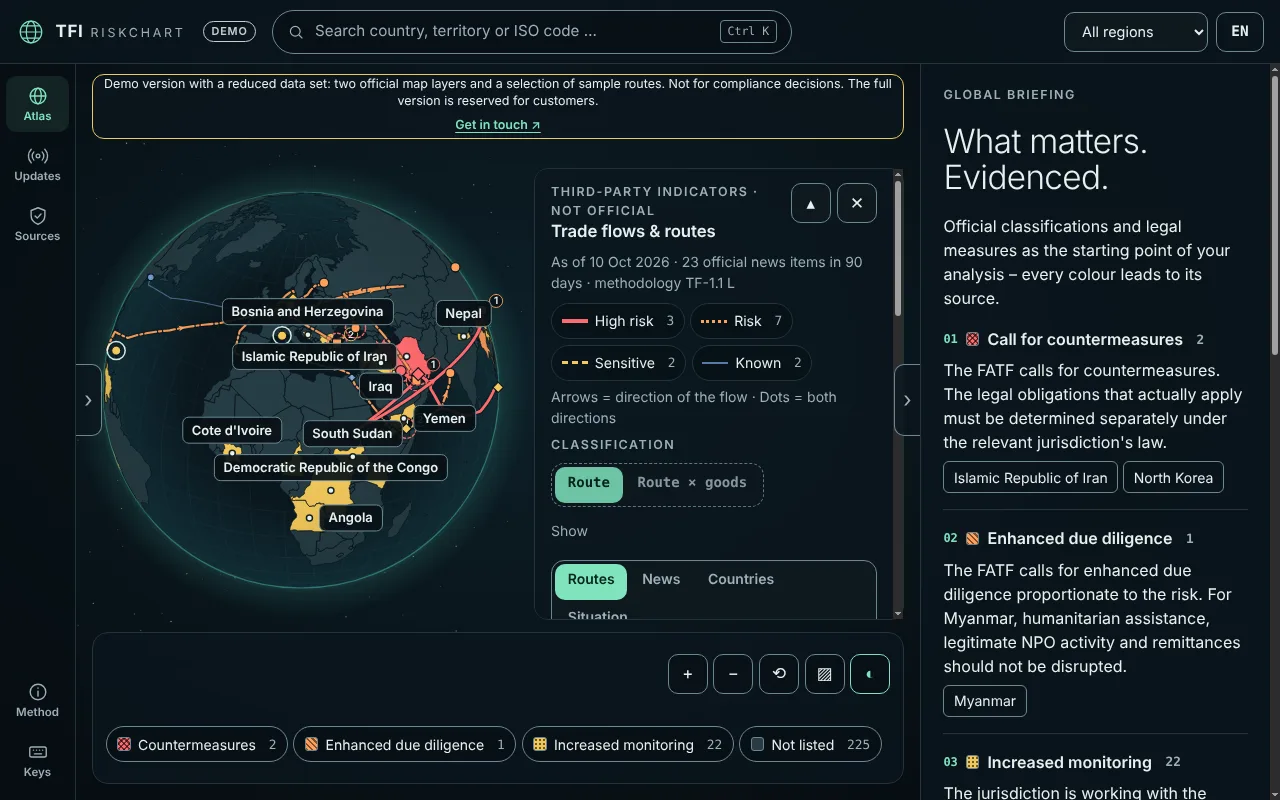
RiskChart in under a minute
Switch layers on, open a country profile with source and date, move between globe, map and table, and see the sources register.
What RiskChart shows
Official layers colour the map; third-party indicators are labelled separately and never shown as “official”. In RiskChart Demo, two layers (FATF lists, EU high-risk list) and 14 selected example routes are freely available; the others are part of the full edition.
FATF lists
In the demoHigh-risk jurisdictions subject to a call for action or enhanced due diligence, and jurisdictions under increased monitoring.
FATF mutual evaluations
Full editionEffectiveness and technical compliance from the latest mutual evaluations of the FATF and the regional bodies.
EU high-risk third countries
In the demoThe Commission list under the AML Directive – decisive for enhanced due diligence.
EU anti-circumvention tool
Full editionCountries for which the EU has found a systematic and persistent risk of circumvention of the Russia sanctions (Art. 12f of Regulation 833/2014) – with the export ban on the goods in Annex XXXIII.
Goods flows and trade routes
In the demoEvidenced routes, ports, chokepoints and transshipment zones – with official circumvention alerts. The demo shows 14 selected example routes (of 75) with officially evidenced findings.
Third-party indicators (not official)
Full editionWorld Bank governance indicators and remittances, Transparency International’s Corruption Perceptions Index – clearly labelled as third-party data.
Sanctions regimes
Full editionCountry-related regimes of the UN, EU, US and UK, and every EU sanctions package against Russia and Belarus as a timeline.
Export controls
Full editionEU general export authorisations (Annex II of the Dual-Use Regulation) and the US country groups of the Export Administration Regulations.
EU tax list
Full editionNon-cooperative jurisdictions for tax purposes (Annex I) and jurisdictions with pending commitments (Annex II).
Two editions
RiskChart Demo
Freely availableReduced demo version, free in the browser, no sign-up, no tracking: two official map layers (FATF lists, EU high-risk list) and 14 selected example routes (of 75) with officially evidenced findings on a globe. No third-party indicators, watchlist, comparison, export or screening; not for compliance decisions.
RiskChart full edition
For engagementsIn addition to the demo: FATF mutual evaluations, the EU anti-circumvention tool, labelled third-party indicators and all trade routes, plus sanctions regimes, export controls, the EU tax list and listings of persons and entities – and also knowledge library, comparison, watchlist, export with source attribution and a printable country dossier. Reserved for clients and not accessible through the website; please contact us. Available within our advisory engagements; client access will be part of the TFI platform.
What you use RiskChart for
- 01
Business-wide risk assessment
Justify the country view transparently – with source, date and methodology version for every classification.
- 02
Onboarding and transaction review
See in seconds which official lists affect a country and what follows from them.
- 03
Circumvention risk in trade
See trade routes, transshipment zones and anti-circumvention measures in context.
- 04
Management and audit reporting
Print country dossiers, export data with source attribution, show what changed since the last update.
Every colour leads to its source.
- 01
Only official categories colour the map; a count is not a risk rating.
- 02
Every statement is evidenced – with a link to the official source.
- 03
“Not listed” only means: no entry on that list. It is not a statement of low risk.
- 04
No legal advice and no clearance: RiskChart is where your analysis starts, not its result.
Frequently asked questions
Is RiskChart a risk score?
No. RiskChart only shows official classifications and labels third-party indicators separately. The risk rating remains your call – RiskChart makes it transparent.
Is RiskChart Demo free?
Yes. RiskChart Demo runs in the browser without sign-up, cookies or tracking and loads no data from third parties. It shows a reduced data set and is not meant for compliance decisions – not a screening result and not legal advice. We use the full edition within our engagements.
How current is the data?
Data is read from the official sources and checked automatically every day. Every layer shows its date; changes appear in the change log.
Can we embed RiskChart in our systems?
Yes. RiskChart can be embedded via iframe and controlled through an interface; your own metrics can appear as an additional layer through an optional gateway. Talk to us.
Use RiskChart in your risk assessment?
We show you RiskChart on your countries and corridors and discuss how the country view fits into your risk assessment.
or write to info@tradefinance-intelligence.com